
Visualising Ngāi Tahu Survey Results
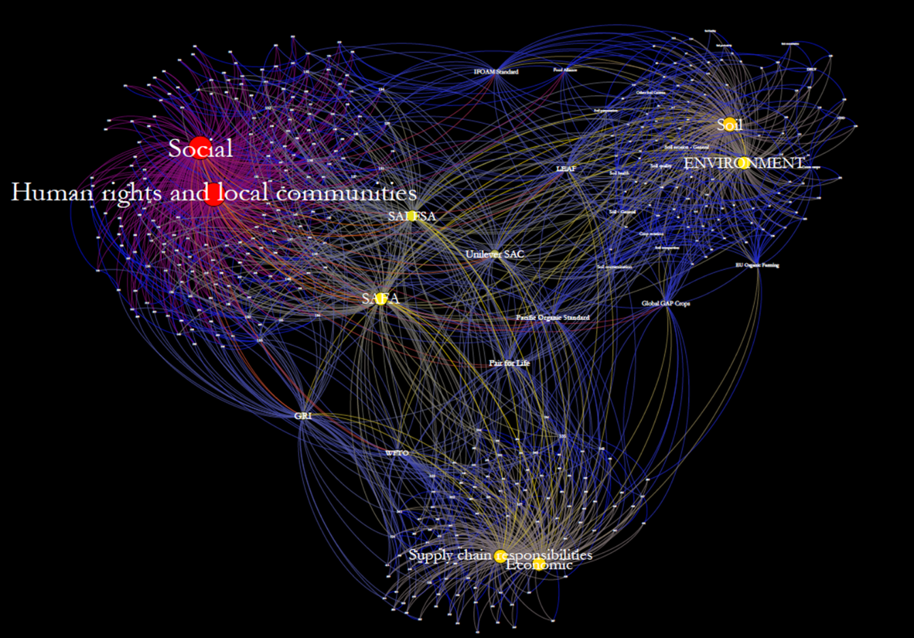
Example network map created for sustainability indicators
The AgriBusiness Group Developed interactive network maps to visualise the results of an internal Ngāi Tahu survey. Interactive network maps allow users to play with data on a website, dragging and clicking on points of interest to explore how different elements relate to each other. By making data interactive the user can tailor the results to their own interests and gain a deep understanding of the results. Ngāi Tahu were able to explore the relationship between the survey results with the overarching values which drive the iwi.
For more information, contact Jay.